Using emoji in Matplotlib
tl;dr
-
Download the Symbola font and install it; using, for instance, the included Font Book application on macOS.
-
Trash Matplotlib’s font cache file (probably located at
~/.matplotlib/fontList.py3k.cache, again for macOS). -
Start your Jupyter Notebook. The font should be available and if it is, it’ll be used to render the final graph. If not, the default font will be used and all of those silly emoji will show up as empty rectangles of sadness.
Background
I’m taking Udacity’s Deep Learning Nanodegree Foundation Program in an effort to expand my skillset and figure out how to have a greater impact with my work. As part of the second project, writing a dog breed classifier, I wanted a way to display emoji to indicate if a person or a dog was found in a photo.
Unfortunately, with Matplotlib, displaying emoji—either rendered emoji or Unicode—doesn’t work with the default font. Some of what I read online suggested using the Apple Color Emoji font, but for a hitherto-unknown reason, loading a font from the System directory wasn’t working for me.
What did work for involved downloading the Symbola font, installing it, deleting Matplotlib’s font cache file, and restarting my Jupyter Notebook. Specifying Symobla as the fontname for my grid meant that I could now render emoji in my subplot output.
It could stand to be more DRY, but here’s what ended up working for my subplot:
fig, axes = plt.subplots(nrows=len(filenames), ncols=4, figsize=(40,40))

for ind, ax in enumerate(axes):
    dog_img = Image.open('images/%s.jpg' % filenames[ind])

    # Not using emoji here, but consistent fonts are key
    axes[ind][0].set_title(filenames[ind], fontsize=32, fontname='Symbola')
    axes[ind][0].imshow(dog_img)
    axes[ind][0].set_axis_off()

    if ind == 0:
        axes[ind][1].set_title('Resnet50', fontsize=32, fontname='Symbola')
        axes[ind][2].set_title('Inception', fontsize=32, fontname='Symbola')
        axes[ind][3].set_title('VGG19', fontsize=32, fontname='Symbola')

    # Resnet50
    axes[ind][1].text(0.5, 0.5, resnet50_results[ind], ha='center', va='center', fontsize=48, fontname='Symbola')
    axes[ind][1].set_axis_off()

    # Inception
    axes[ind][2].text(0.5, 0.5, inception_results[ind], ha='center', va='center', fontsize=48, fontname='Symbola')
    axes[ind][2].set_axis_off()

    # VGG19
    axes[ind][3].text(0.5, 0.5, vgg19_results[ind], ha='center', va='center', fontsize=48, fontname='Symbola')
    axes[ind][3].set_axis_off()

fig.tight_layout()
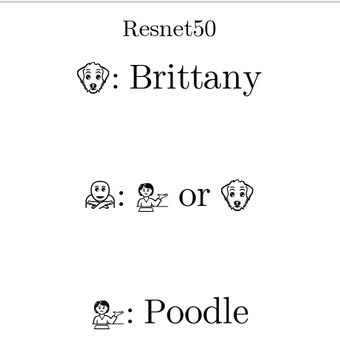
And part of that output: